Know what every landlordis earning and costing.
A monthly dashboard with leases, nights booked and revenue against past years, plus analytics, add-ons sold, tenant balances, portfolio by type, and property-level income and expenses.
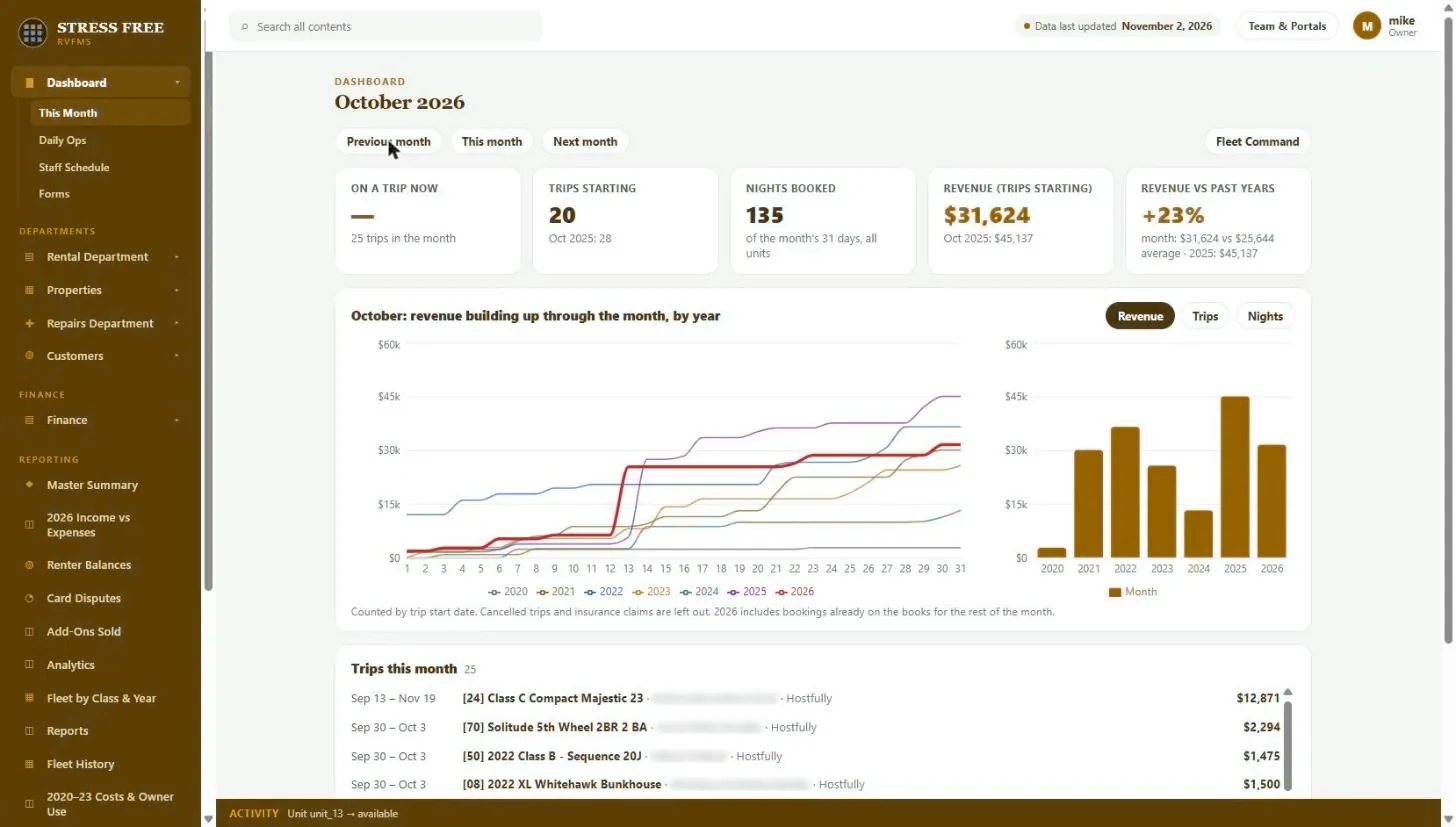
You know roughly how the month is going. You do not know whether this October is ahead of last October, which properties are carrying the portfolio, or what the add-on program is actually bringing in, because the numbers are spread across a booking platform, a payment processor and an accountant’s spreadsheet.
The LANDLORDms monthly dashboard shows leases starting, nights booked and revenue for the month, compared with the same month in past years, and a chart of revenue building through the month. Behind it sit analytics by year, add-ons sold, tenant balances, card disputes, portfolio by type, history and income against expenses.
Capabilities
- Month view with leases, nights booked and revenue
- Same month compared across past years
- Revenue build-up chart by day of month
- Leases list for the month, by property and channel
- Add-ons sold, tenant balances and card disputes
- Portfolio by type, and property-level income and expenses
- Landing view with properties occupied now, leases coming up and leases just completed
What you get back
Decisions on real numbers
See which properties, classes and channels earn, and which ones cost.
Spot a slow month early
Pacing against past years shows trouble while there is still time to act.
Ready for owners and lenders
Clean, consistent reports instead of a scramble before every meeting.
Monthly dashboard: FAQ
How far back does reporting go?
As far back as your imported history. Past bookings brought in during onboarding show up in year-over-year comparisons.
Are cancelled leases counted?
No. Cancelled leases and insurance claims are left out of revenue and nights.
See it with your own portfolio.
We will walk through monthly dashboard using your properties, your channels and the way you already work.